- The Dataset Behind the Credit Card Churn Prediction Model
- Credit Card Churn Prediction: A Four-Model Comparison
- Fixing the Imbalance with SMOTE
- Tuning the Models with Grid Search
- Key Design Decisions in Credit Card Churn Prediction
- Credit Card Churn Prediction in Practice
- Reproduce It If You Want
- Final Thoughts on Credit Card Churn Prediction
Credit card churn prediction starts with a simple truth: keeping a customer is cheaper than finding a new one, yet most retention campaigns arrive too late. By the time a customer calls to cancel, the decision was already made weeks ago in the data. The trick is reading those early signals before the phone rings.
This credit card churn prediction project is a machine learning study on a real credit card portfolio. The goal was simple: can we predict which customers are about to leave, based only on their behaviour? If the answer is yes, the bank can intervene with offers, support, or product changes instead of watching them disappear.
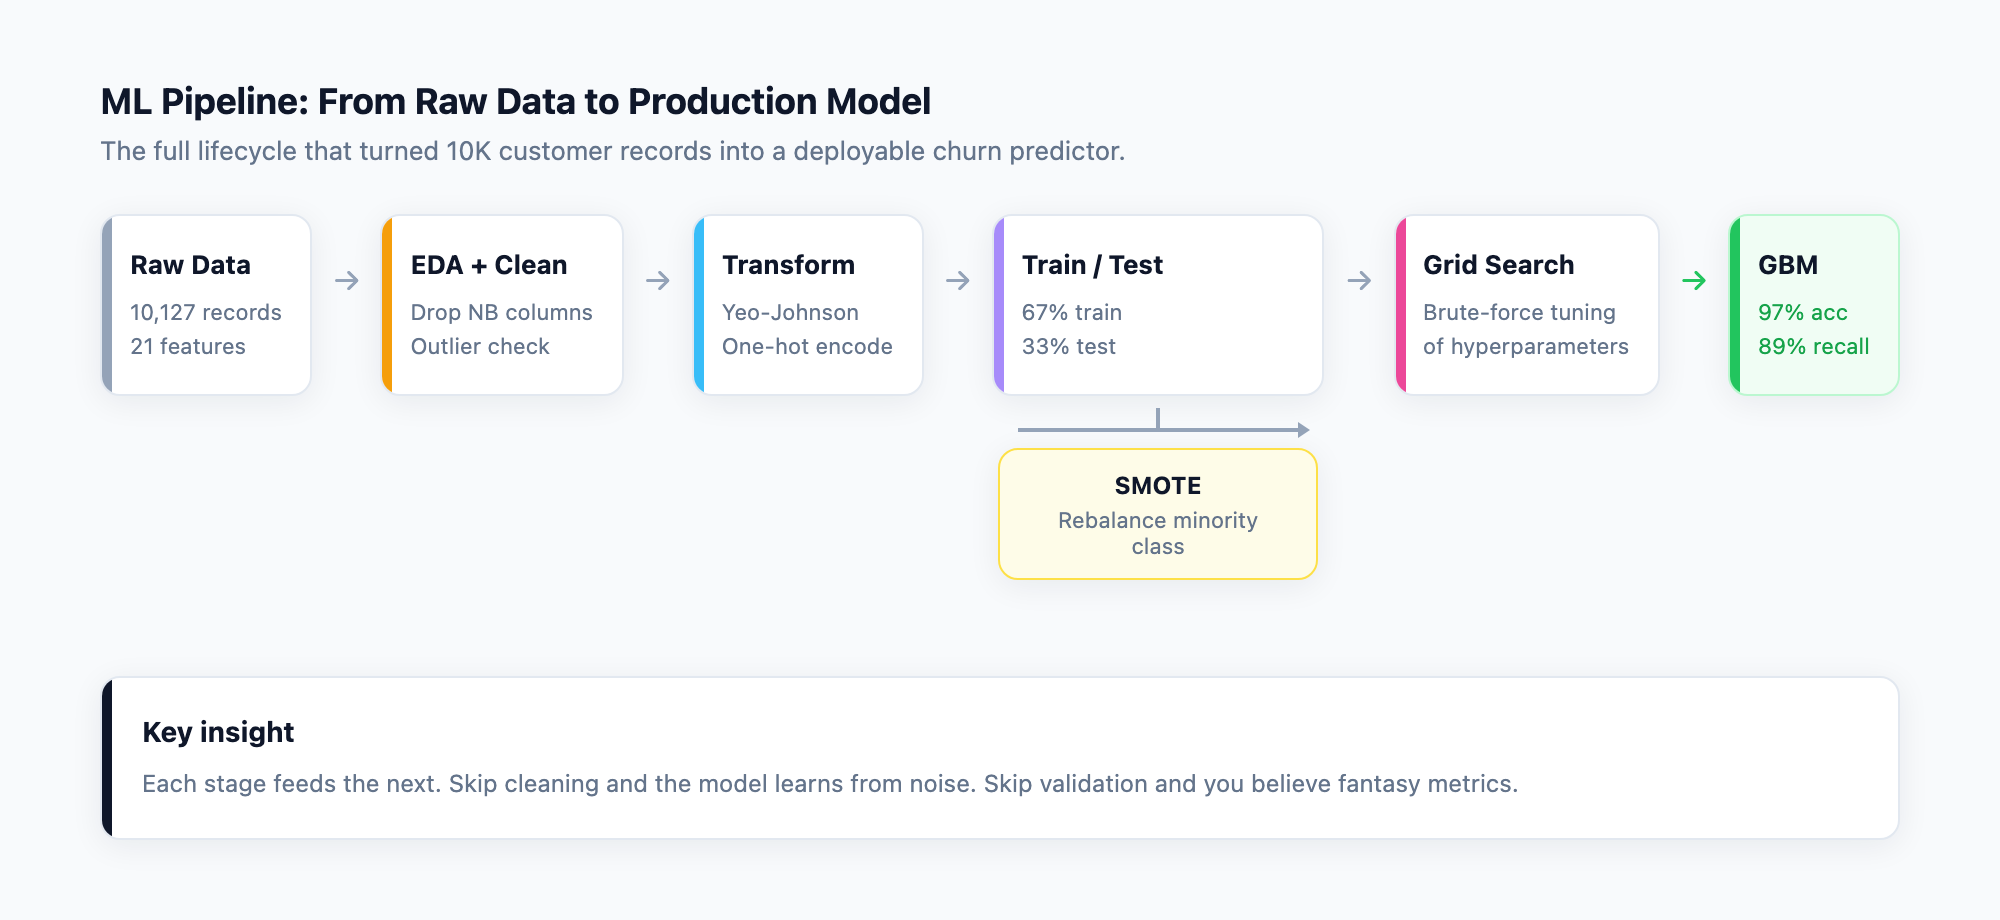
The best model in this credit card churn prediction pipeline achieved 97% overall accuracy and 89% churn recall using nothing more than demographic and transactional data the bank already collects. Every step is documented and reproducible. The full notebook and code are available at banking-churn-predictor on GitHub.
Quick Overview
What I Built
10K Customer Dataset
Real credit card portfolio for credit card churn prediction with demographic, financial, and behavioural features.
97% Model Accuracy
GBM after hyperparameter tuning via Grid Search. SMOTE rebalancing tested separately.
89% Churn Recall
Catches 9 out of 10 at-risk customers, the only metric that matters.
Class Imbalance Fixed
SMOTE generated synthetic minority samples so models learned from balanced data.
Fully Reproducible
End-to-end Jupyter notebook with fixed random seed.
The Dataset Behind the Credit Card Churn Prediction Model
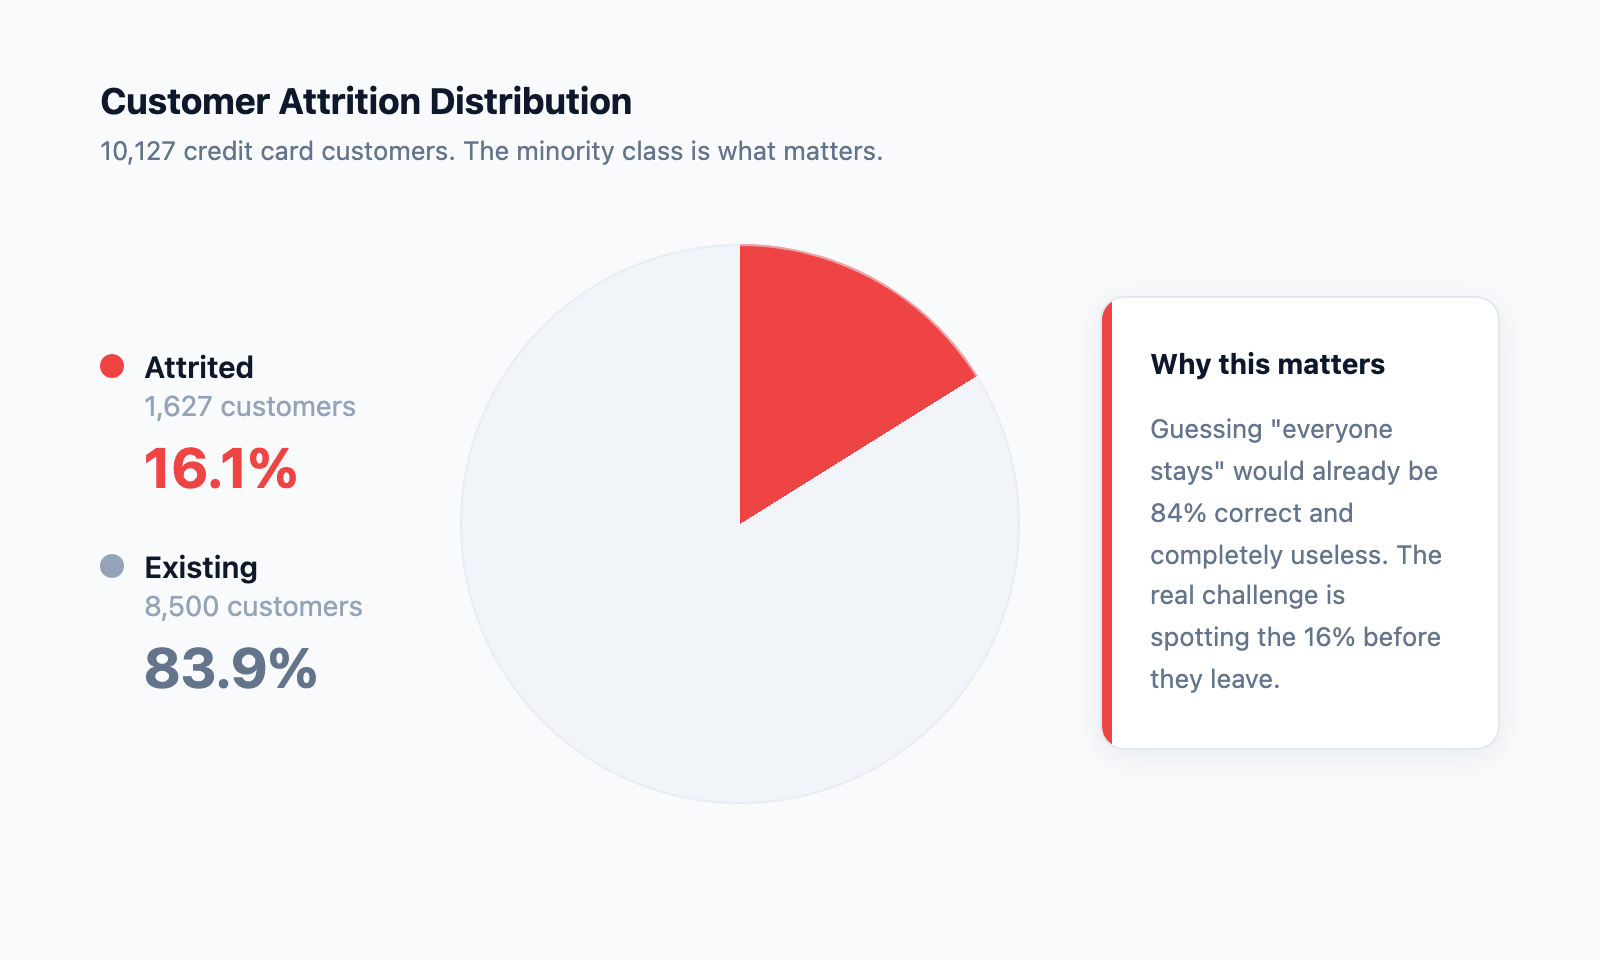
The dataset contains 10,127 credit card customers. Roughly 84% are still active, and 16% have already left. That imbalance is the first challenge: if you blindly guess “everyone stays,” you are already 84% correct and completely useless.
The features are what you would expect from a bank:
- Demographics: age, gender, education level, marital status, and income bracket.
- Relationship: how long they have held the card, how many products they use, how often the bank contacts them.
- Behaviour: transaction count and volume over the last year, change in activity from quarter to quarter, months of inactivity.
- Financial: credit limit, revolving balance, open-to-buy credit, and average utilization ratio.
There are no missing values, which is rare in real data and made the Exploratory Data Analysis (EDA) and cleaning phase straightforward. EDA is the process of visualising and summarising a dataset before modelling, looking for outliers, odd distributions, and relationships between features that could trip up the algorithms later. Before building the credit card churn prediction model, two synthetic probability columns generated by a prior Naive Bayes model were dropped so the new models could learn from the raw features instead of inheriting someone else’s assumptions.
The strongest visual finding from the exploration phase was that churn is not evenly distributed. Graduate-degree holders make up the largest attrited segment, and customers with lower credit limits churn at higher relative rates. The relationship between activity and loyalty is not linear: customers who suddenly reduce their transaction frequency are the most likely to leave, even if their account balance looks healthy.
Credit Card Churn Prediction: A Four-Model Comparison
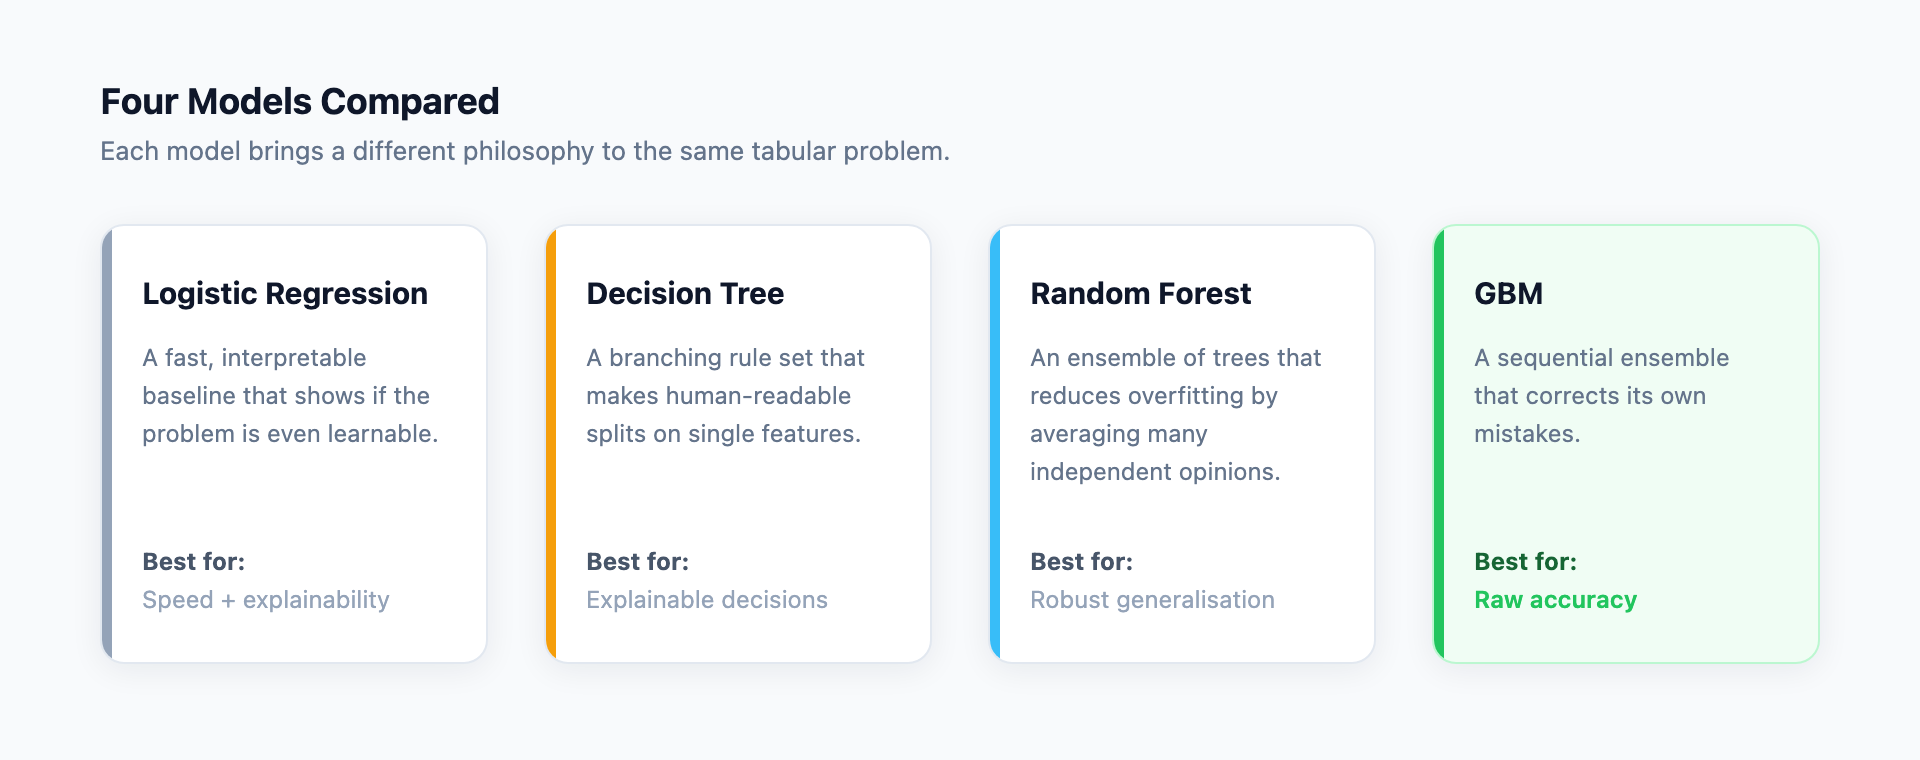
Rather than betting on a single algorithm for this credit card churn prediction task, I trained and compared four approaches:
- Logistic Regression: a fast, interpretable baseline that shows whether the problem is even learnable.
- Decision Tree: a branching rule set that makes human-readable splits, useful for explaining why a customer was flagged.
- Random Forest: an ensemble of trees that reduces overfitting by averaging many independent opinions.
- Gradient Boosting Machine (GBM): a sequential ensemble that corrects its own mistakes, often the strongest performer on tabular data.
Each model was evaluated on a held-out test set representing one third of the data. The key metric for this credit card churn prediction task was not just overall accuracy, but the recall for attrited customers – the proportion of actual leavers the model successfully catches. A retention team only cares about this number.
 Catching 99% of stayers while missing 80% of leavers is a failing system.
Fixing the Imbalance with SMOTE
Before rebalancing, every model struggled with the minority class. The raw GBM, the strongest candidate, only caught 84% of attrited customers despite 96% overall accuracy. The problem was the dataset itself: with so few positive examples, the models had not learned what “about to churn” truly looks like in this credit card churn prediction context.
I applied SMOTE (Synthetic Minority Over-sampling Technique) to the training data. SMOTE creates synthetic churners by blending features from real attrited customers, expanding the minority class without duplicating existing rows. After rebalancing, all four models in the credit card churn prediction pipeline improved their churn recall significantly:
The trade-off was a slight dip in overall accuracy for some models, because the rebalanced data forced them to pay more attention to edge cases they previously ignored.
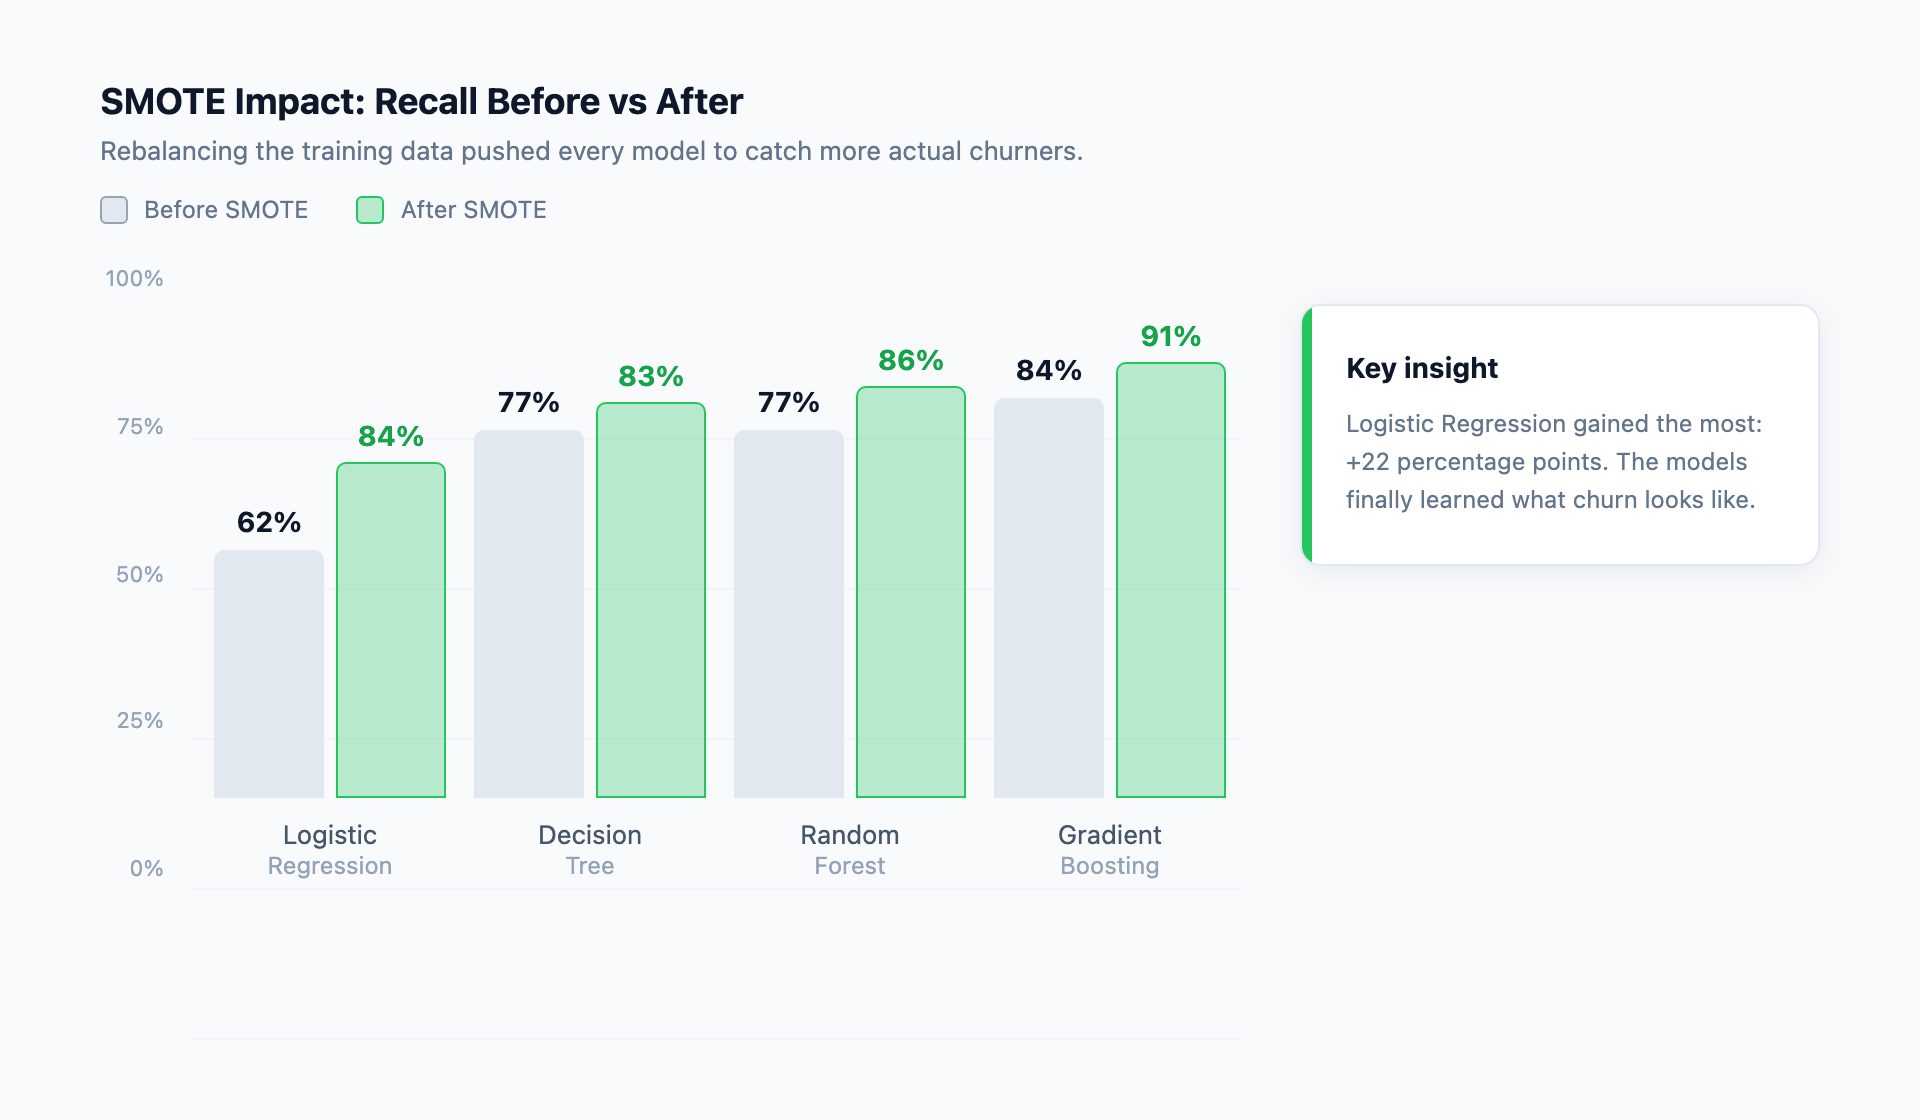 But the real win was churn recall: GBM went from catching 84% of leavers to 91%, and Logistic Regression went from an embarrassing 62% to a respectable 84%.
Tuning the Models with Grid Search
After the SMOTE experiment, I ran a separate Grid Search on the original training data (without SMOTE) to find optimal hyperparameters for each model. Grid Search is brute-force: define a grid of settings, train a model for every combination, and keep the winner.
The results were mixed, which is a useful lesson in itself. Grid Search did not help Logistic Regression at all, and it slightly hurt Random Forest. But it improved Decision Tree accuracy from 93% to 94% and pushed GBM to its best overall performance:
For this credit card churn prediction task, the GBM model was the clear winner. At 97% overall accuracy and 89% churn recall, it caught nearly 9 out of 10 customers who actually left, while keeping false alarms low enough that a retention team could realistically follow up on every flag.
One limitation of this project is that the two best techniques were tested separately rather than combined. The ideal next step would be to run Grid Search on the SMOTE-resampled data, which could potentially produce even better results. That said, the results above already demonstrate that both rebalancing and tuning are essential, and that GBM is the strongest candidate for this particular dataset.
Key Design Decisions in Credit Card Churn Prediction
1. Yeo-Johnson transformation instead of simple log transforms: the dataset contained negative values from ratio changes, so Box-Cox was not applicable. Yeo-Johnson handled both positive and negative outliers in a single pass, stabilizing the variance for all four models in this credit card churn prediction pipeline.
2. One-hot encoding over label encoding: categorical variables like education level and income bracket have no natural order. Label encoding would have falsely told the models that “Graduate > High School > Unknown,” which is nonsensical. One-hot encoding treats each category as its own binary signal.
3. SMOTE before tuning, not after: rebalancing changes the decision boundary, so hyperparameters tuned on imbalanced data would not transfer. The correct pipeline for credit card churn prediction is balance first, then tune.
Credit Card Churn Prediction in Practice
A retention team running this credit card churn prediction model on a portfolio of 10,000 customers would receive roughly 1,600 churn alerts. Of those, about 1,450 would be genuine at-risk customers who would otherwise leave undetected. The remaining 150 would be false alarms – customers flagged incorrectly but worth a quick check-in call anyway.
The alternative is doing nothing and losing 1,627 customers. Or sending blanket offers to all 10,000 and wasting 84% of the budget on people who were never going to leave.
The credit card churn prediction model does not replace human judgment. It replaces guesswork with a ranked list.
Reproduce It If You Want
The credit card churn prediction notebook and dataset are available for review on GitHub at banking-churn-predictor. If you want to rerun the analysis yourself, you need Python, scikit-learn, and a free afternoon. Every figure and table is regenerated from the raw data.
Quick-start commands
python -m venv venv – create isolated environment
pip install -r requirements.txt – install pandas, scikit-learn, imbalanced-learn, seaborn
jupyter notebook churn_analysis.ipynb – run the analysis top to bottom
Final Thoughts on Credit Card Churn Prediction
This credit card churn prediction project is a textbook example of why the machine learning workflow matters more than the algorithm. GBM is a strong model, but it only reached 97% accuracy because the data was properly cleaned, outliers were transformed, the class imbalance was addressed, and hyperparameters were tuned in the right order.
The credit card churn prediction workflow is a template. The same workflow that produced these results – cleaning noisy data, correcting class imbalance, tuning models, and validating against real metrics rather than vanity ones – applies to fraud detection, threat hunting, or any scenario where the rare event is the only one that matters.